
The Vehicle List
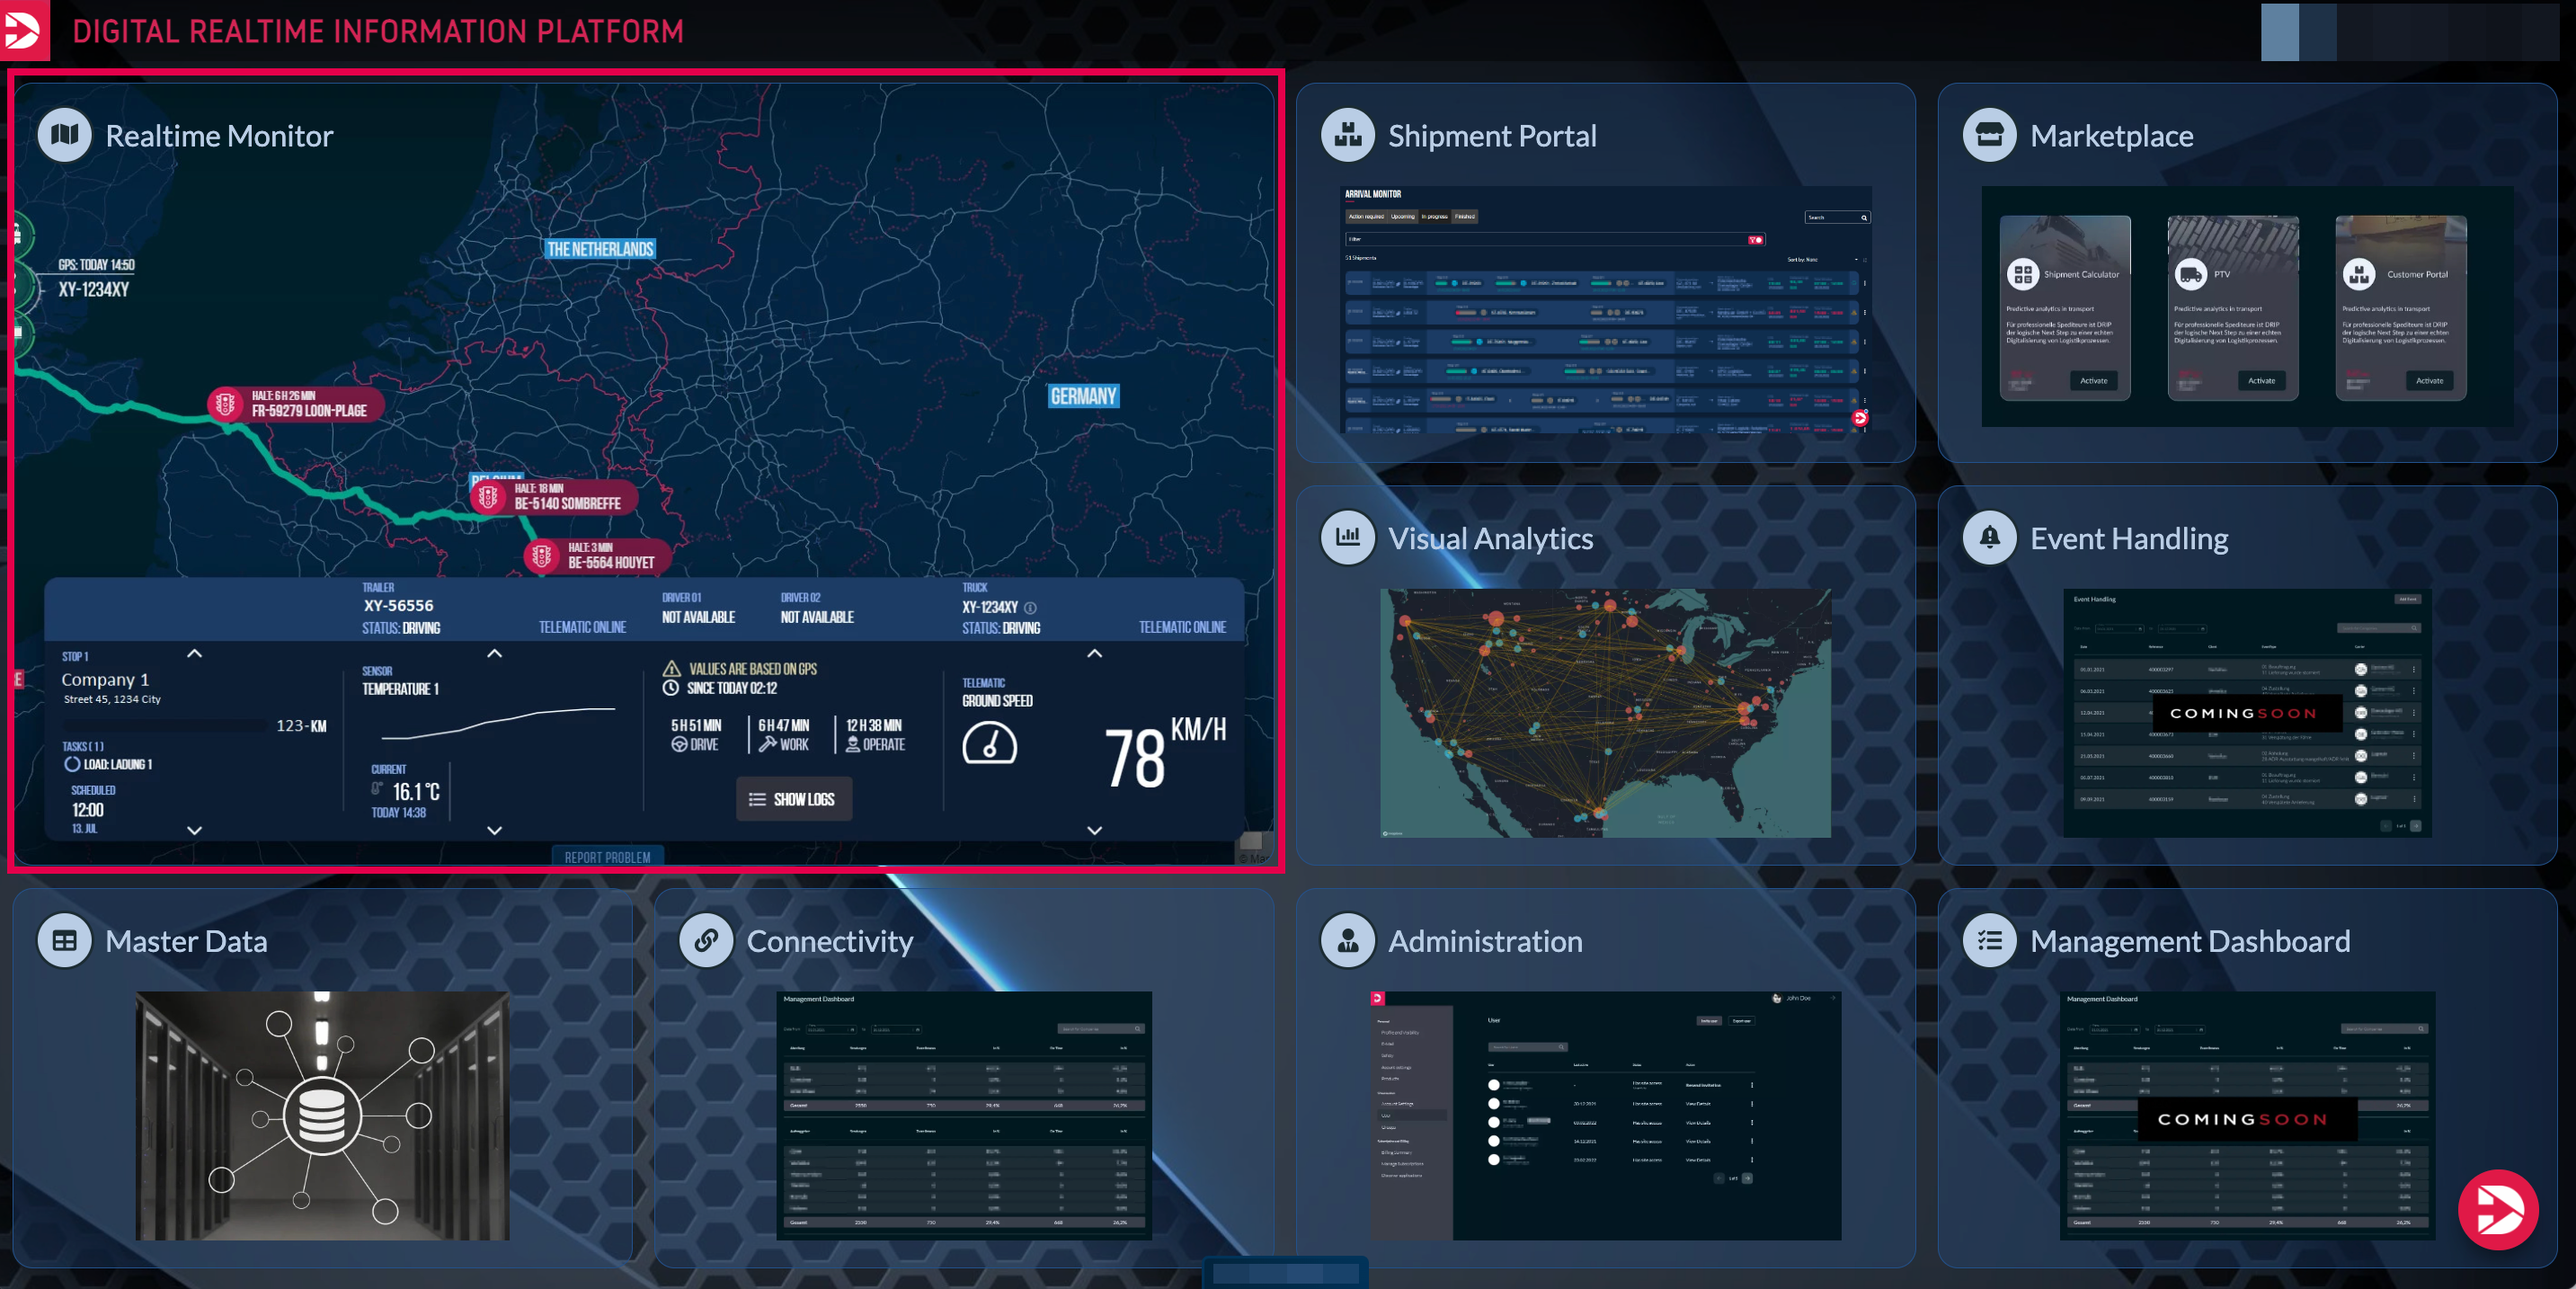
To get to the vehicle list, click on the Real-Time Monitor area on the homepage.
Next, click on the top car - icon in the sidebar for the device list. (1)
As a result, the device list opens with a map view in the overview, displaying all vehicles along with their current positions. Vehicles will only be shown if you have connected a telematic system or if vehicles have been shared with you.
In the upper section of this area, you have the option to filter the vehicles in the list by type. (2)
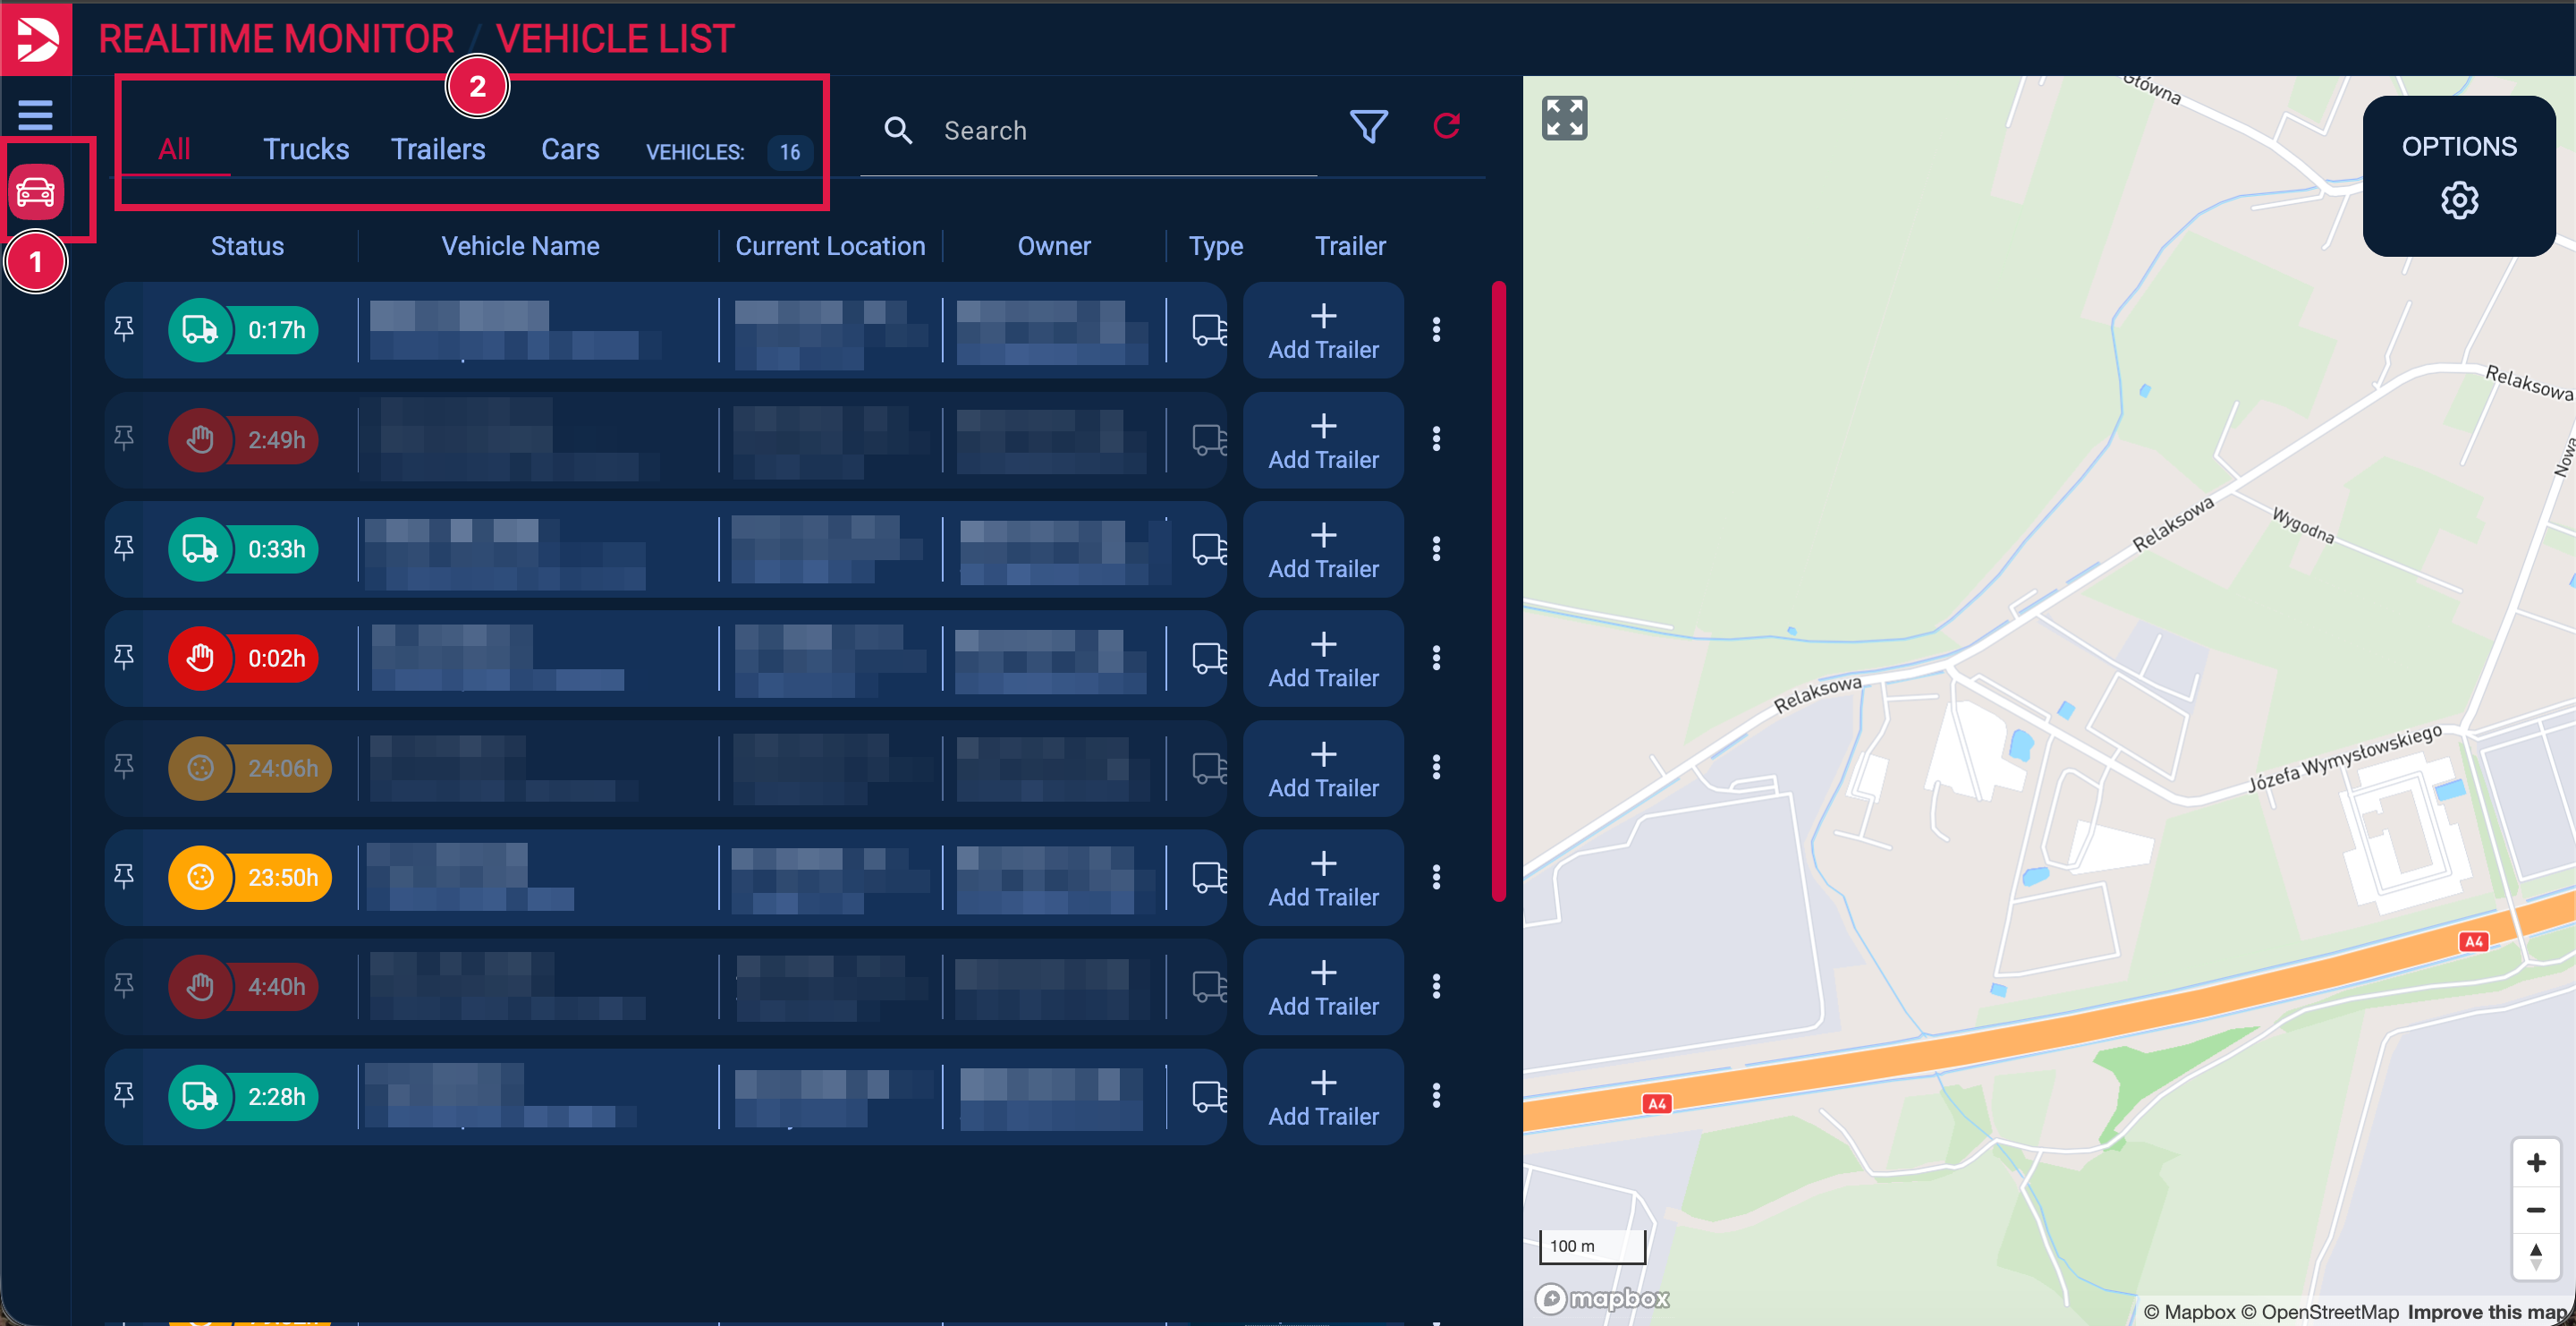
In the device list, each vehicle profile displays the main important information such as status, name, current location, owner, and type.

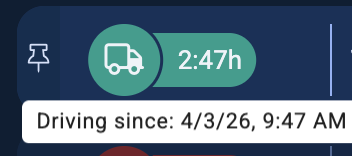
A green vehicle icon indicates that the vehicle is currently moving.
If you hover over the icon with your mouse, the date and time of the last transmitted position will be displayed.
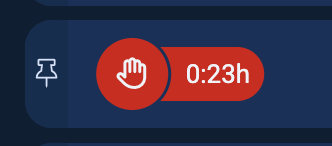
A red icon means that the vehicle is currently stationary. The duration of the standstill is also displayed.

A yellow icon indicates a break. This status appears when a vehicle has been stationary for more than 9 hours. The current duration of the break is also displayed here.
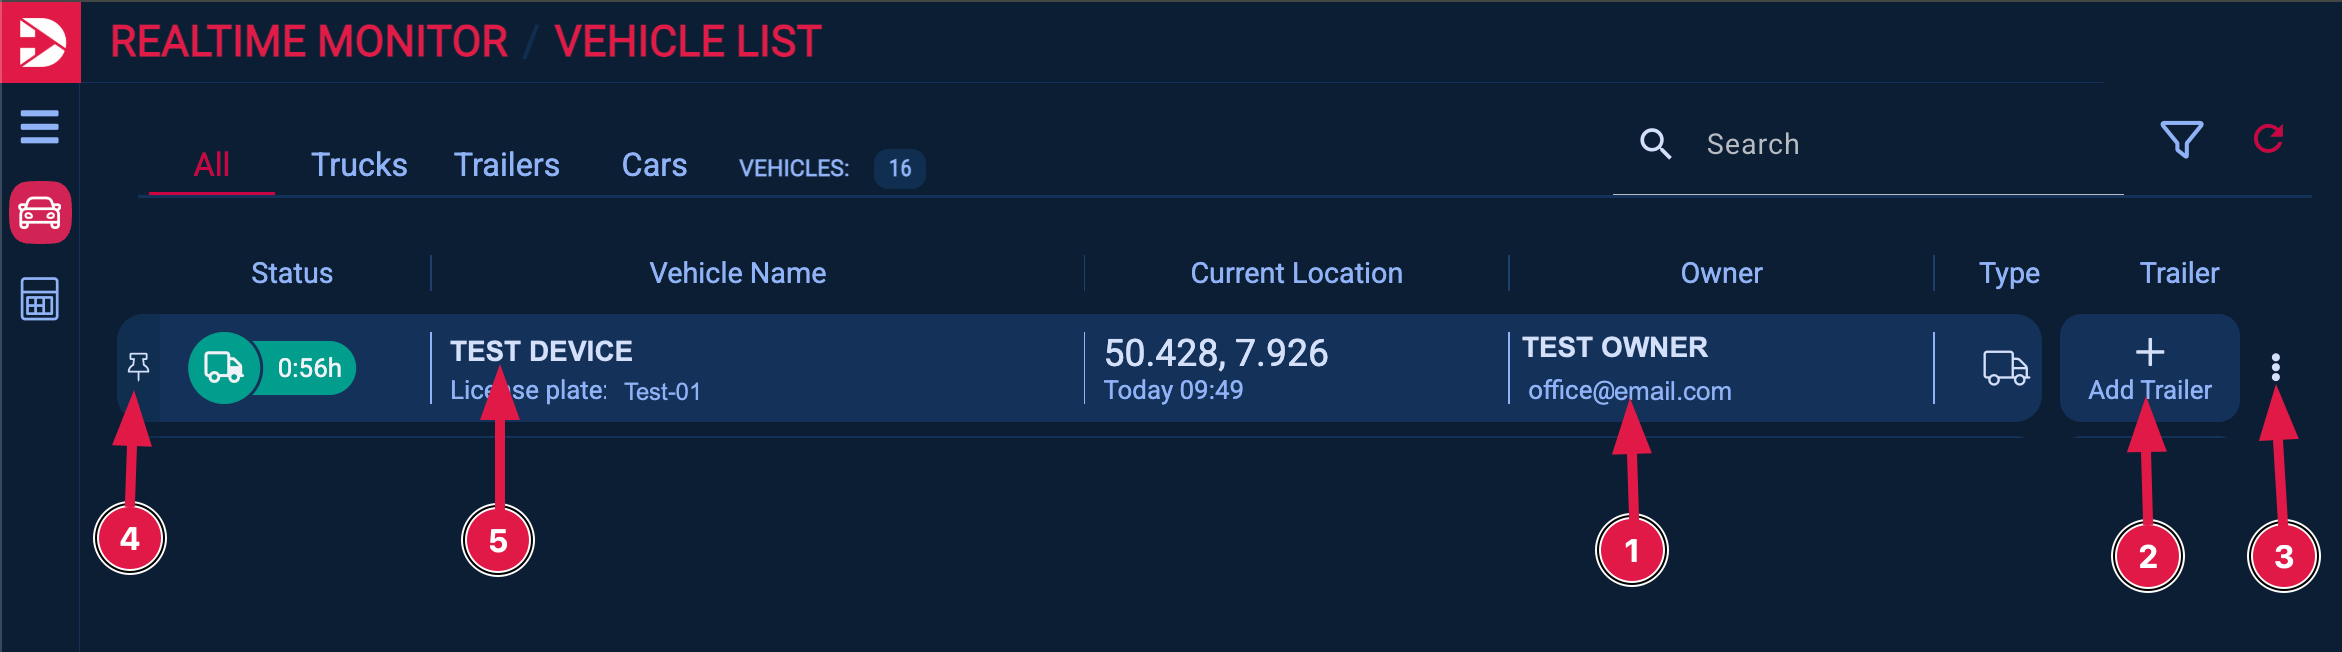
By clicking on the email address (1), you will be redirected to your email app, where you can write an email to the owner of the selected vehicle. Here (2), you have the option to add a trailer. If you click on the selection button (3), you will find options such as vehicle details and "Open history".
By clicking on the pin (4), you can pin a vehicle to the top of the list.
If you would like to view further details (such as the logbook) for a vehicle, click on the vehicle name (5).
The overview will then open below the vehicle profile.
By clicking on the “current location” section, the vehicle will be displayed on the map at the last received position.
If you click on the speed icon, a window will open below with further information such as speed, driver, and additional details.
You also have the option to view the vehicle logs.
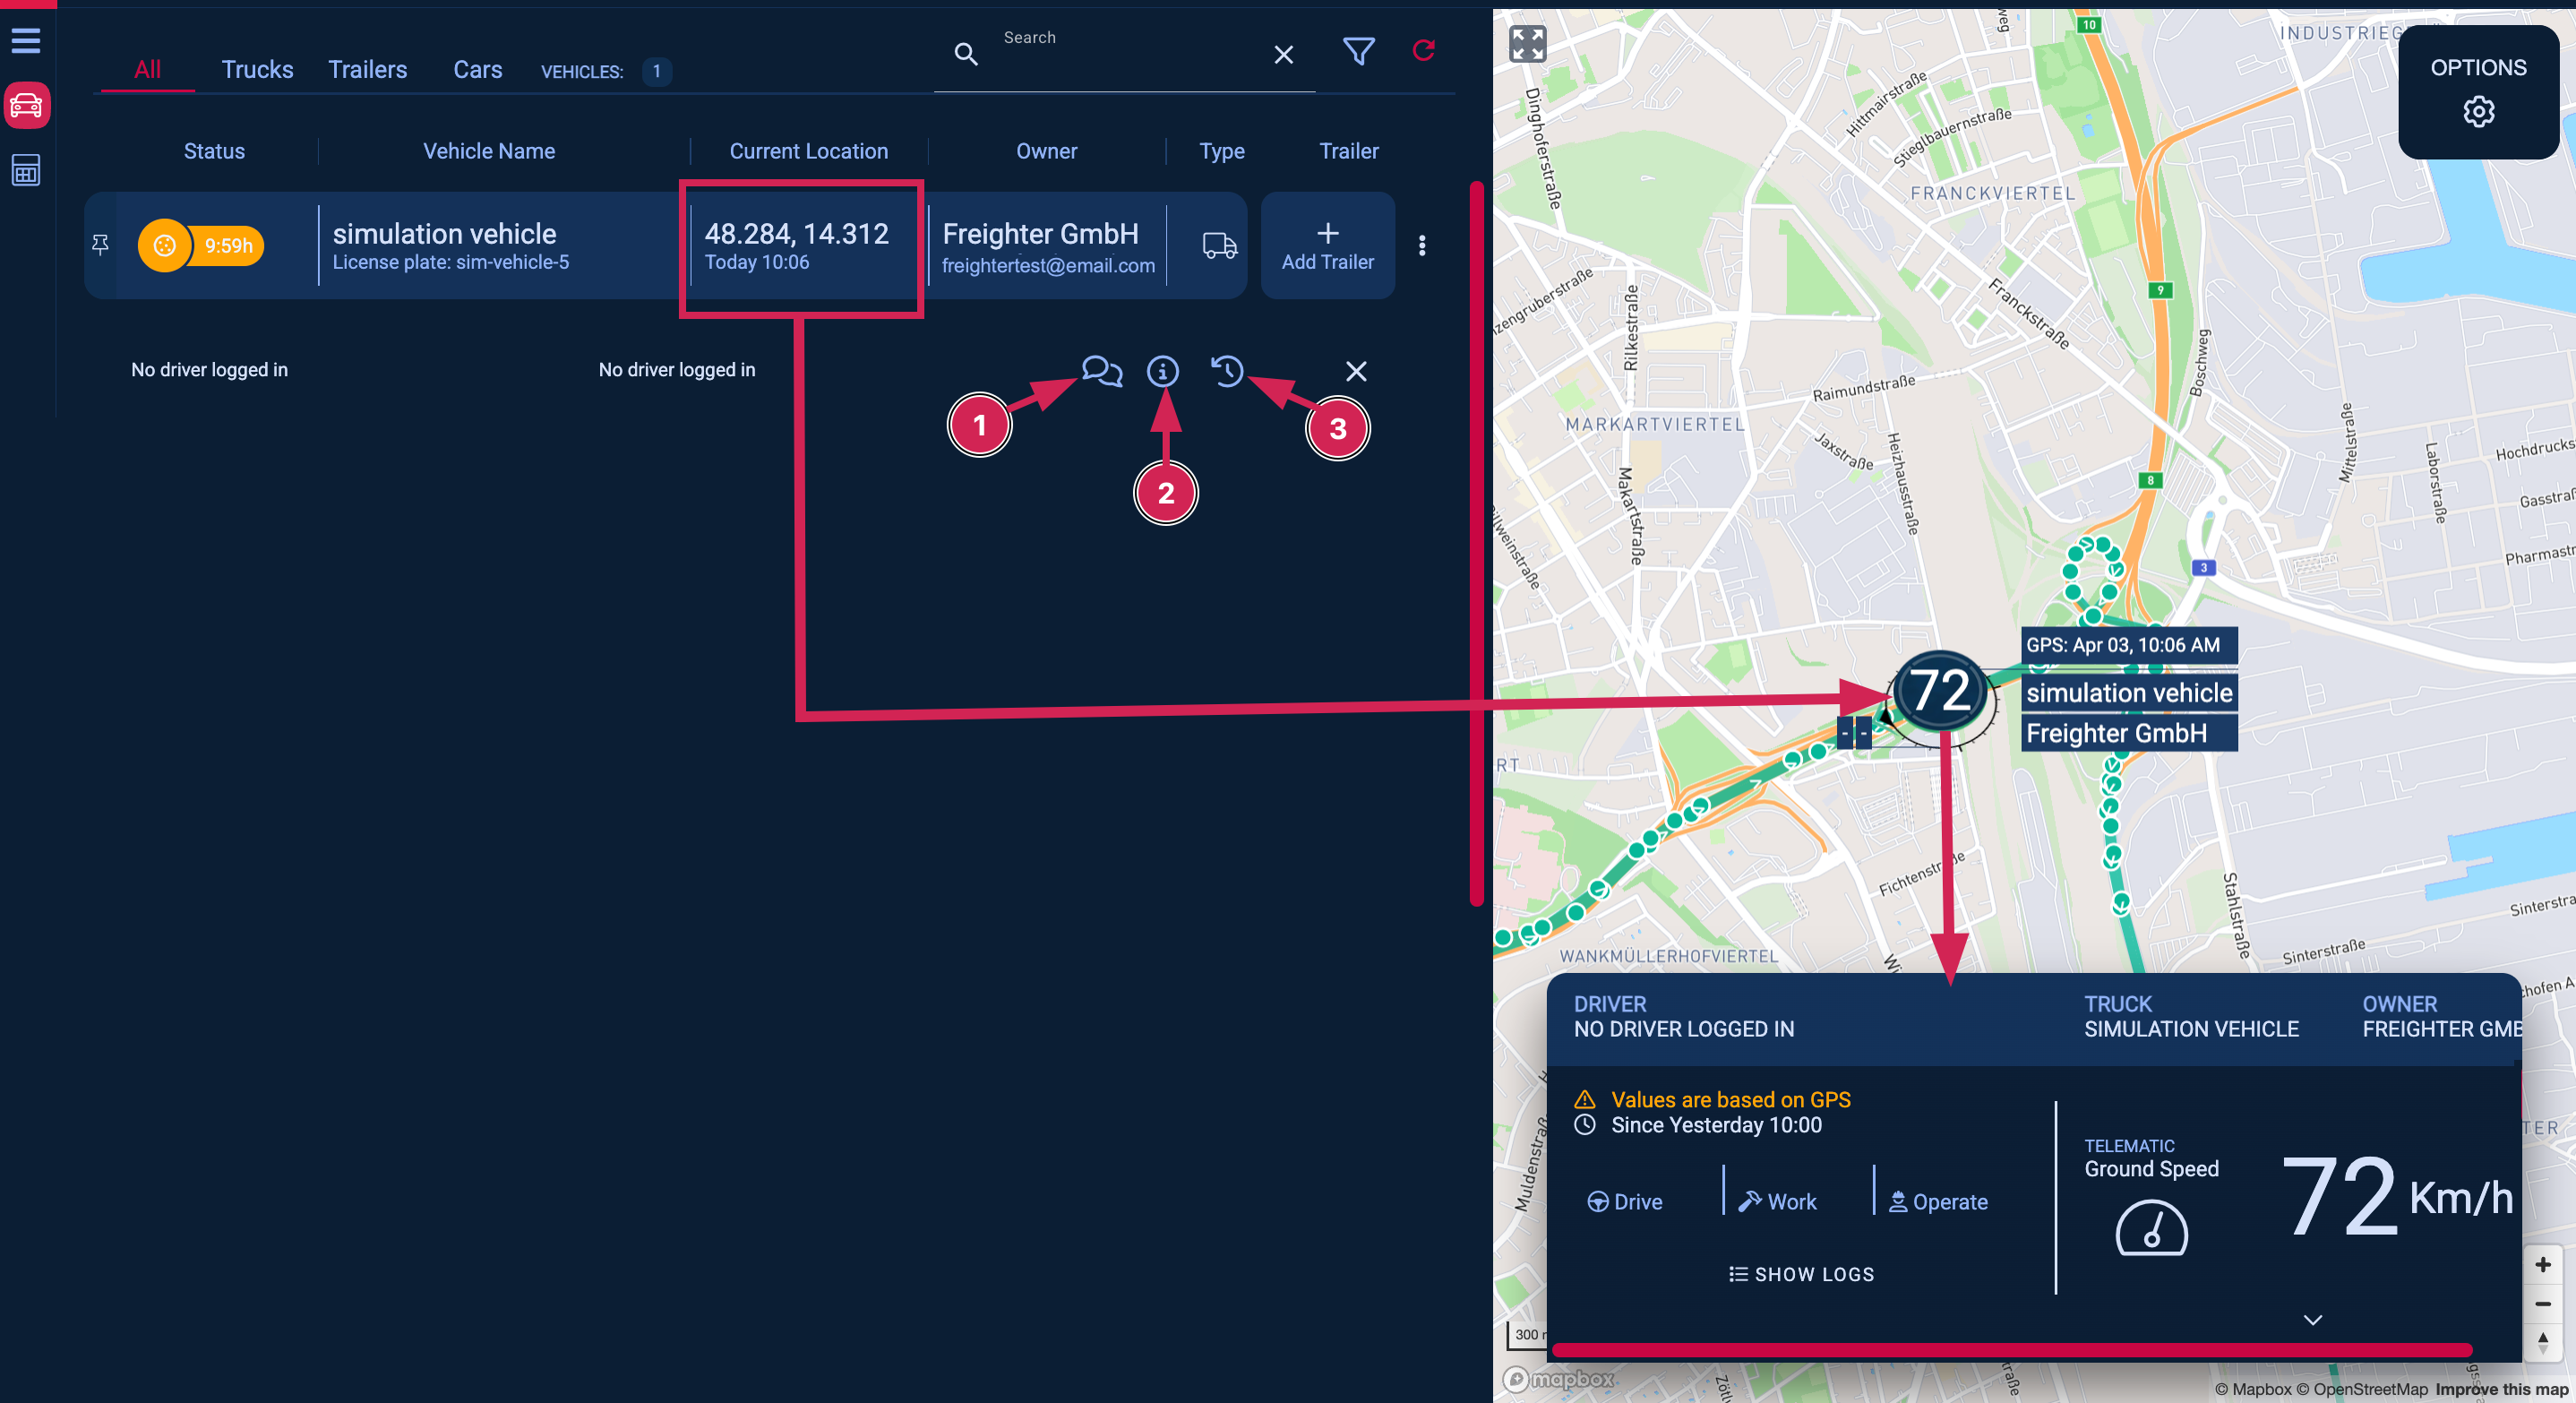
If you select the chat icon (1), the chat will open – here, dispatchers can communicate with each other or a dispatcher can communicate with a driver who has previously connected to a truck via the D4D app.
By selecting the info button (2), an additional info box will open where you have the option to change the license plate and/or the vehicle name.
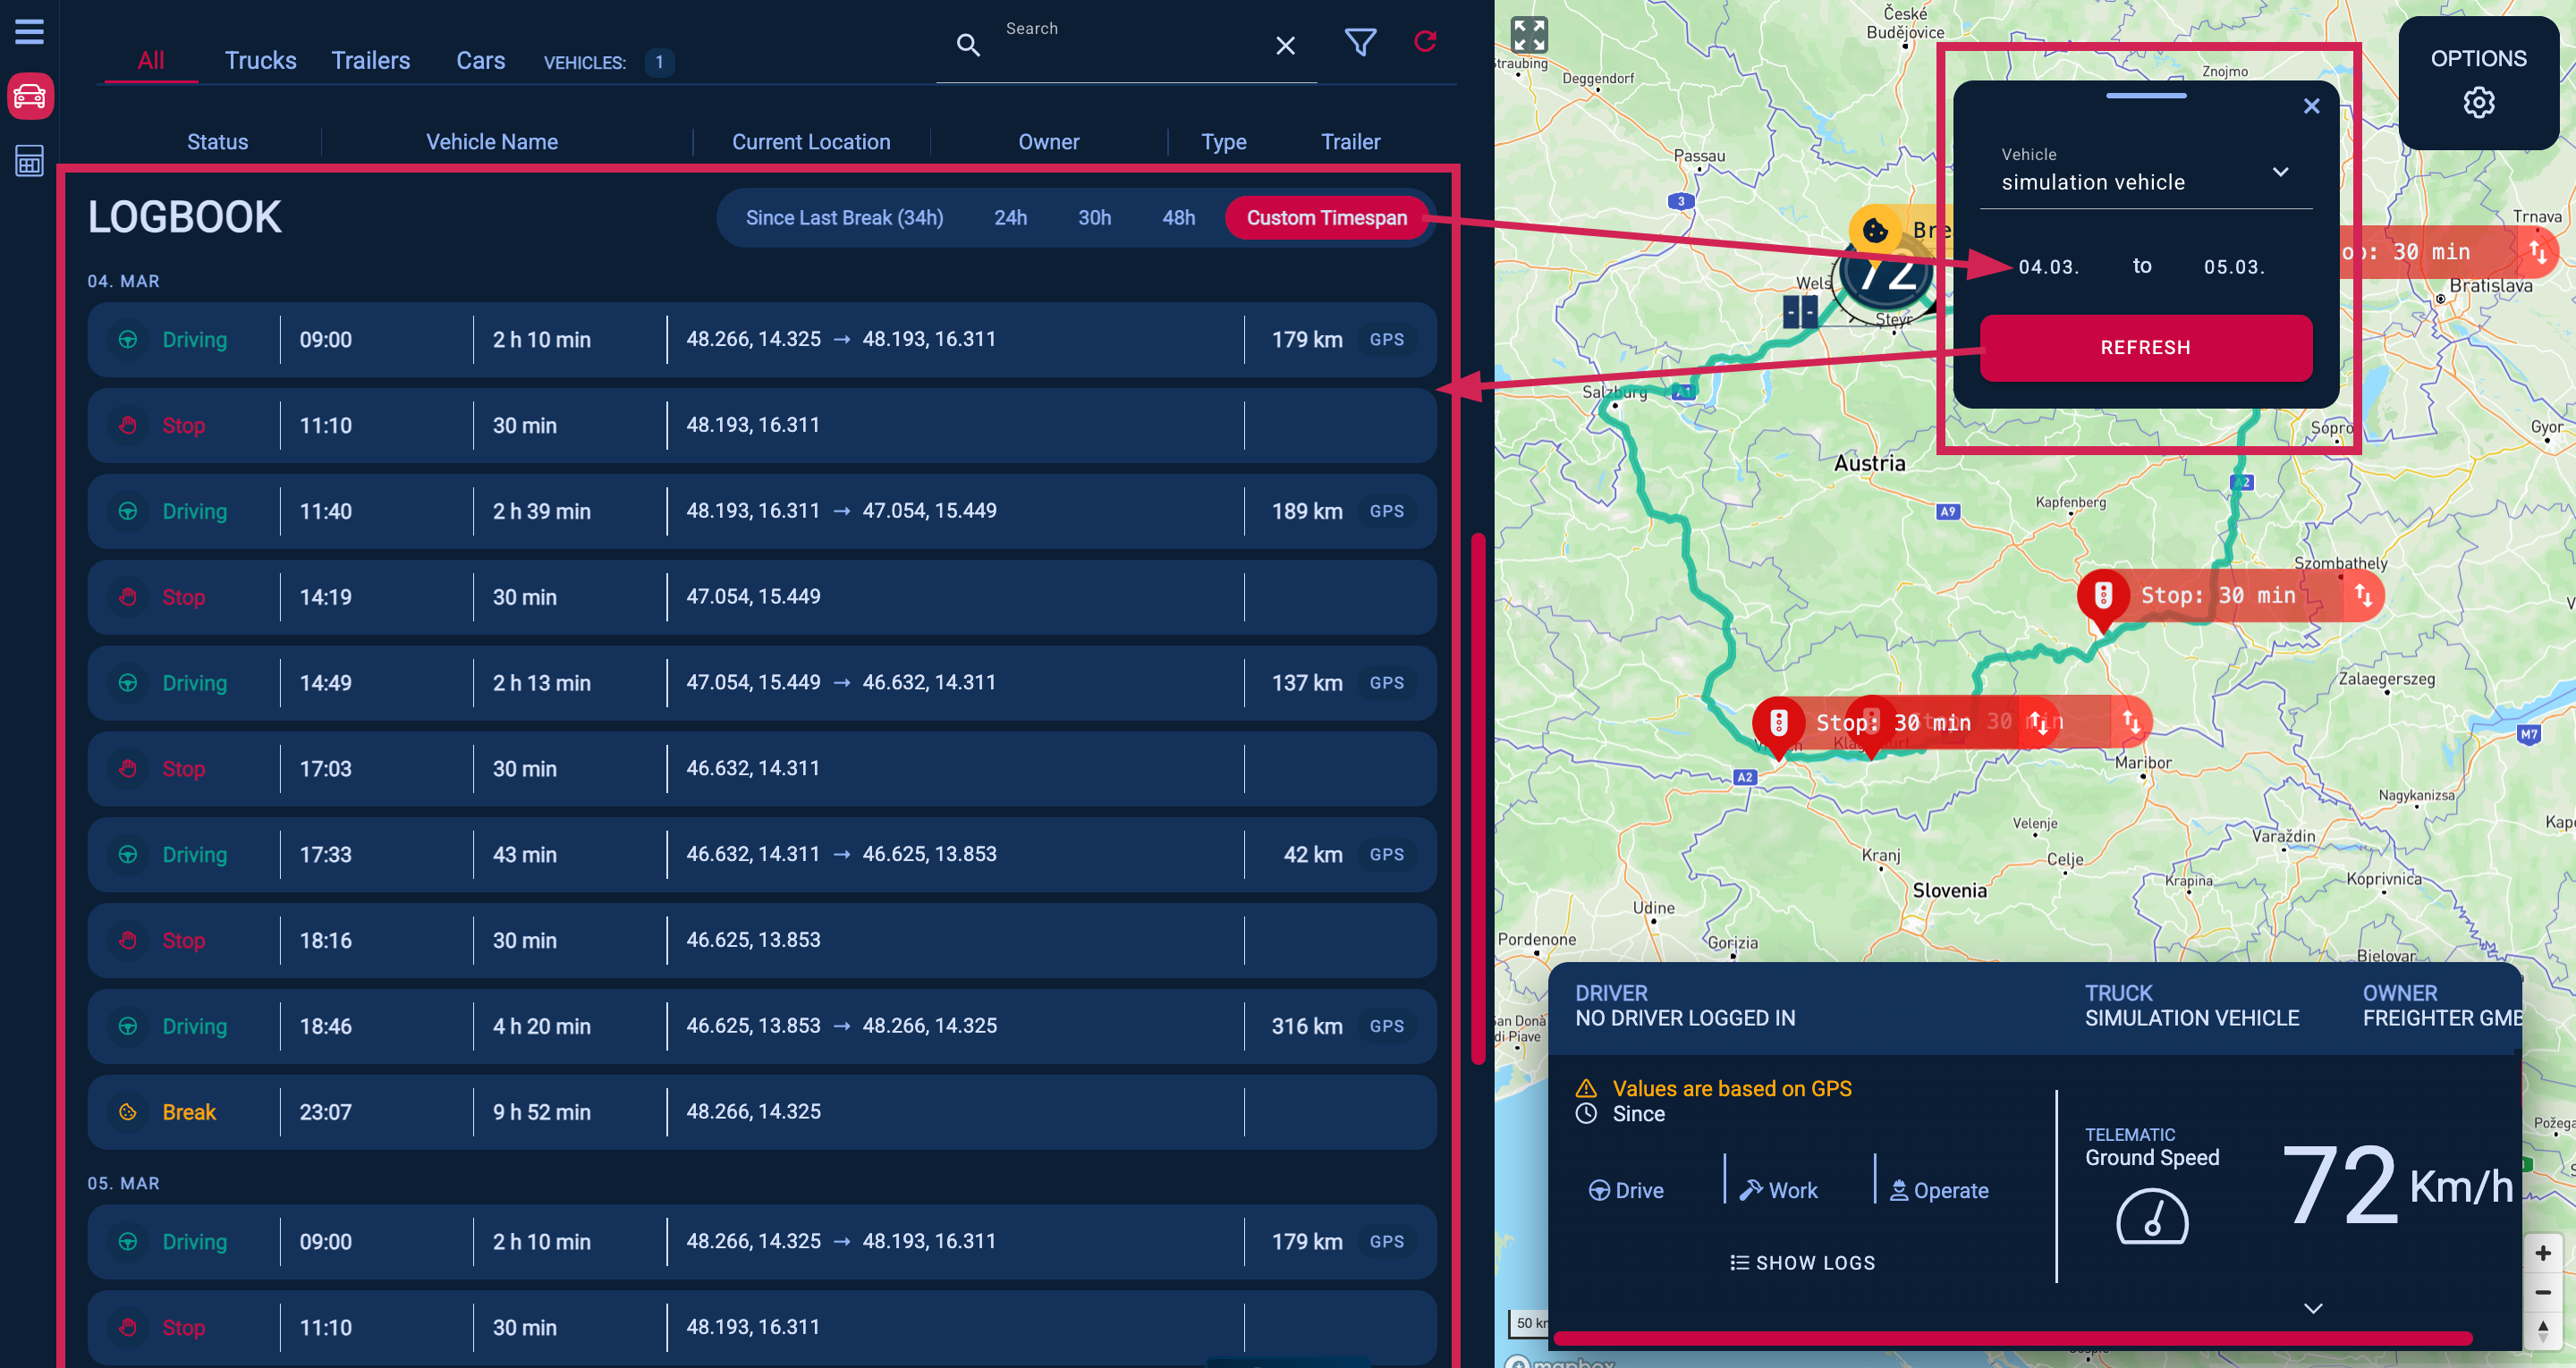
By clicking on the history button (3), you can view the position data on the map and the logs of a vehicle for a specific period in the past.
If a vehicle is currently on a tour, you can also view this information in the real-time monitor. More information can be found here: Tour information in the Realtime Monitor available