Visual Analytics
This section allows you to generate reports for individual assets within a selected time period.
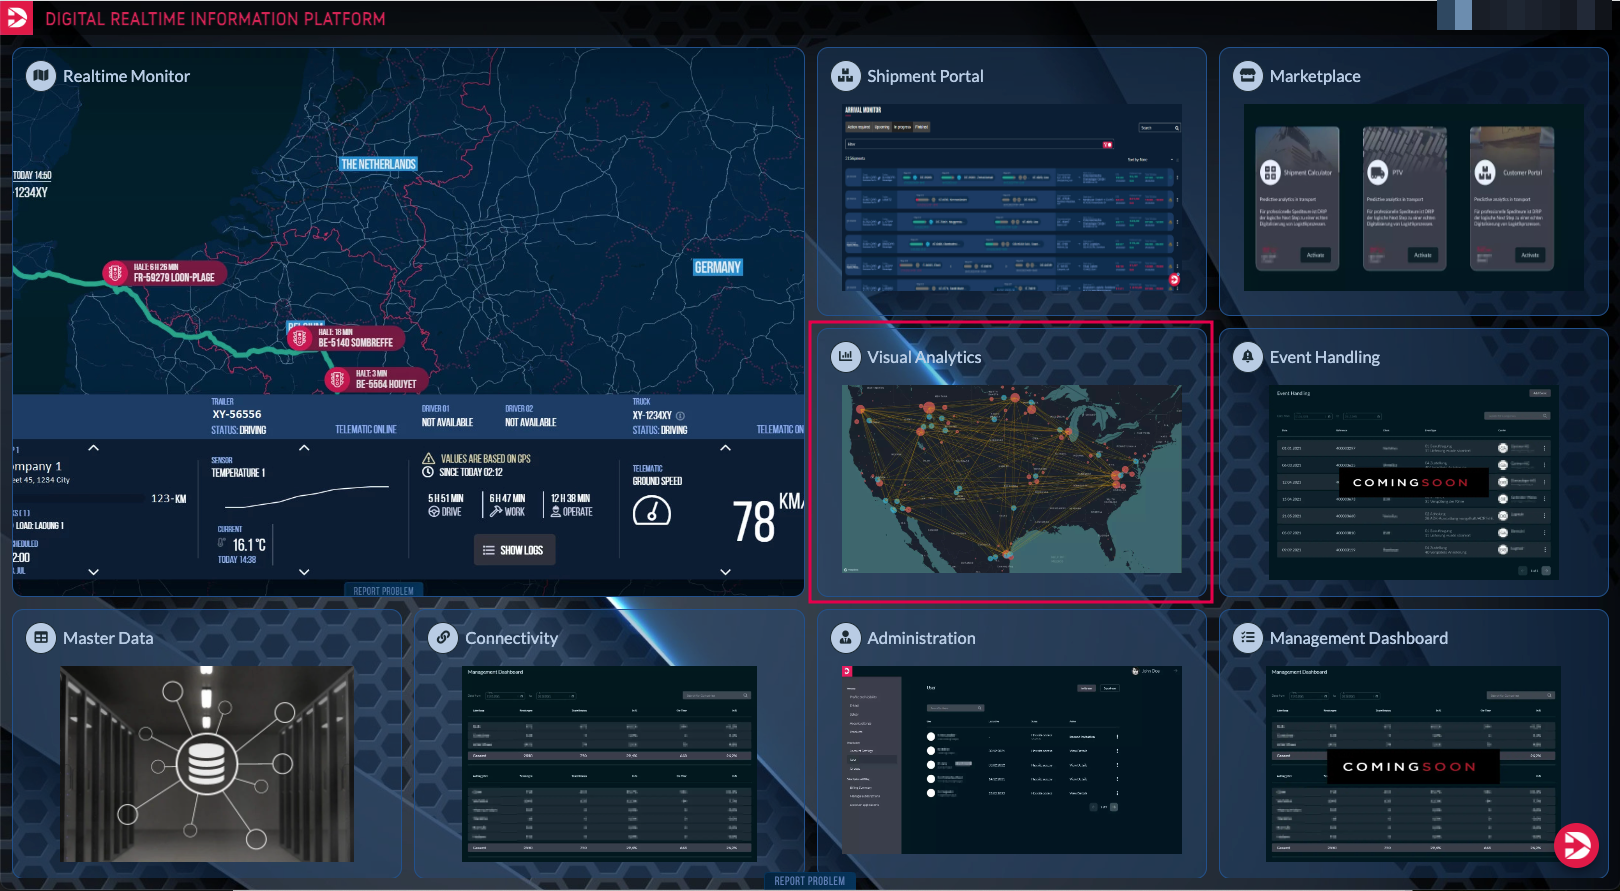
Open the “Visual Analysis” area on the homepage to generate reports on the corresponding subpage.
In the opening overview, the first step is to enter the required asset into the input field.
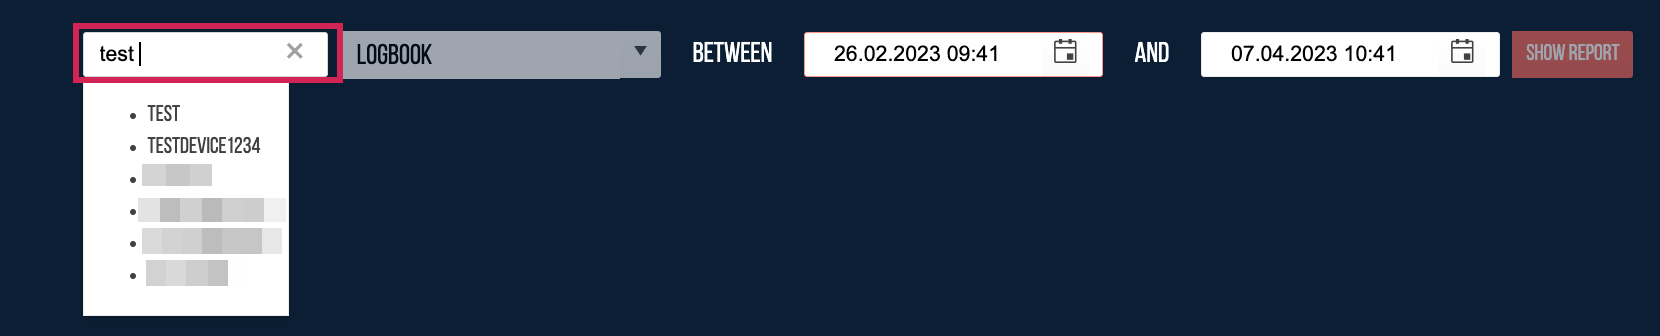
Then, choose a parameter by which the report will be generated (in our example the logbook).

Next, you need to select the start date and time of the reporting period.
You click on the calendar icon (1) and select the corresponding date (in our example the 28. of February (2))
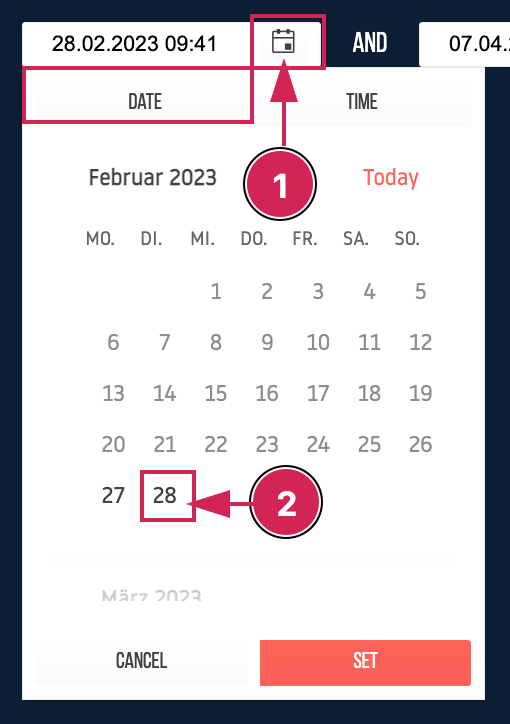
The overview automatically switches to the time input.
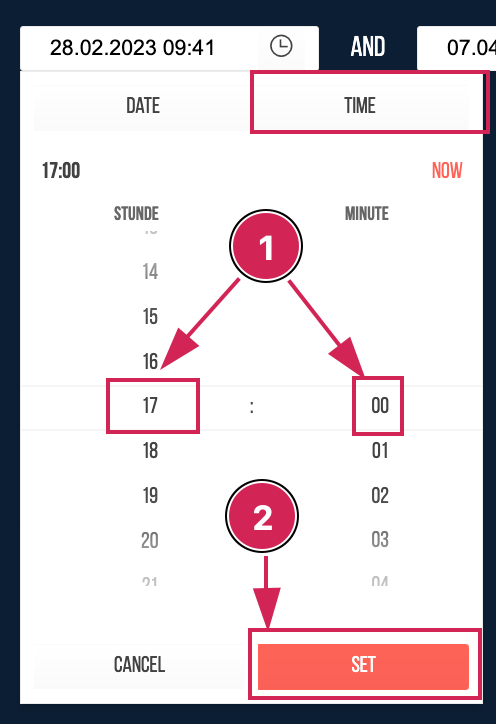
Here you can select the corresponding time( in our example 17:00) by clicking on the hours and minutes (1), and confirm your selection by clicking the 'set' button (2).
In the next step, you need to enter the end date and time of the period (as you did with the start date before) and subsequently press the "show report" button.

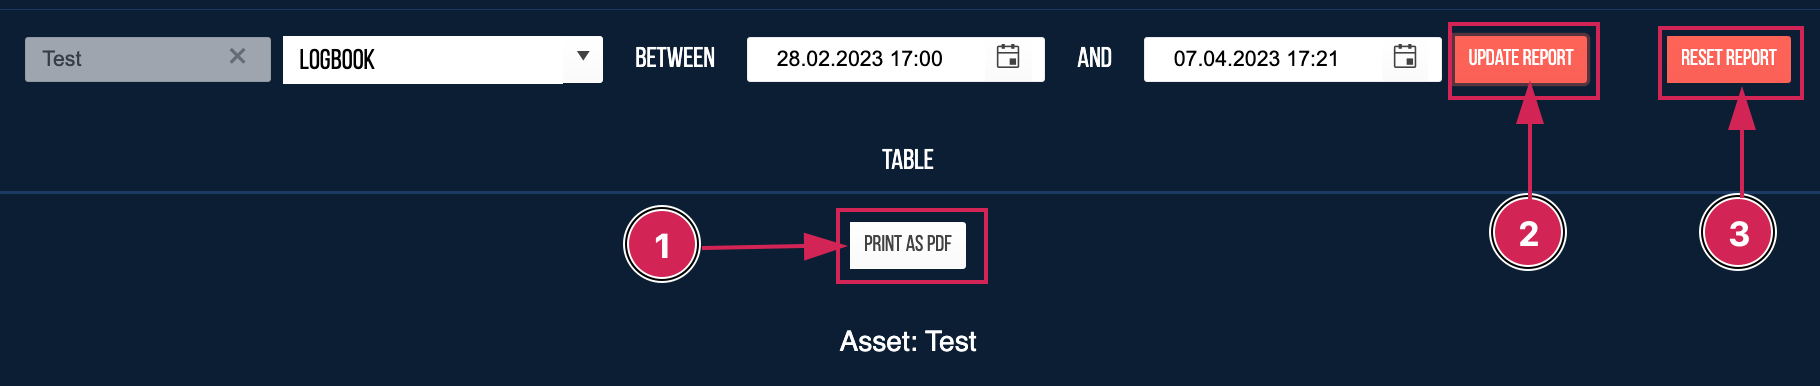
When the report has been generated, you have the option to export it as a PDF (1), reset it(3), or modify the entered data and update (2) the report.